SOL Price Prediction: Can Solana Break $200 Amid Key Technical and Fundamental Signals?

#SOL
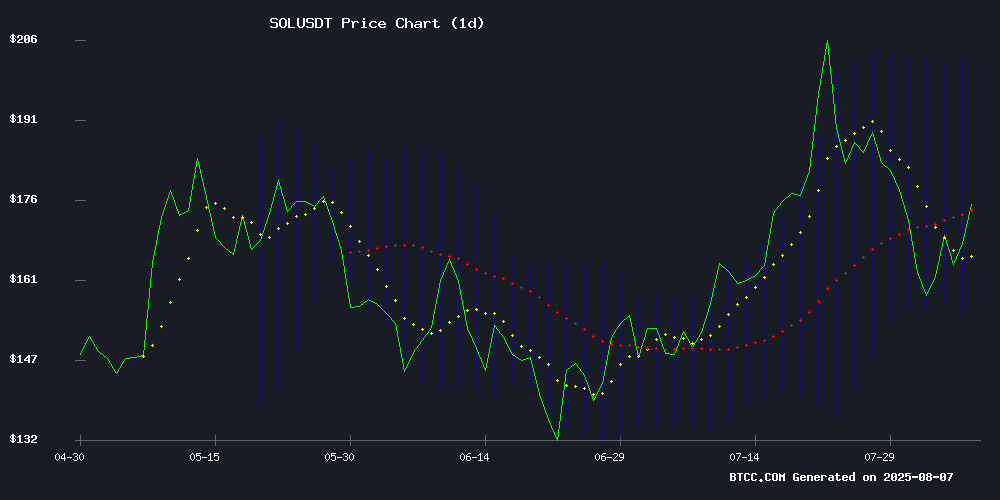
- Technical Squeeze: Bollinger Band contraction suggests an impending volatility spike, with $201.98 as the upper target.
- Ecosystem Momentum: Solana's DeFi and meme coin activity drive network revenue, supporting price appreciation.
- Regulatory Tailwind: SEC's staking ruling removes a potential overhang, boosting investor confidence.
SOL Price Prediction
SOL Technical Analysis: Key Indicators to Watch
SOL is currently trading at $170.95, below its 20-day moving average (MA) of $178.13, indicating potential short-term bearish pressure. The MACD shows a positive histogram at 9.2878, suggesting bullish momentum may still persist. Bollinger Bands reveal a squeeze with the upper band at $201.98 and the lower at $154.29, signaling reduced volatility and a possible breakout ahead. According to BTCC financial analyst Ava, 'A sustained MOVE above the 20-day MA could reignite bullish sentiment, while failure to hold $168 may trigger further downside.'
Market Sentiment: Solana's Bullish Catalysts
Solana's price action is testing a contracting triangle pattern with resistance at $168, while headlines highlight bullish triggers: SEC's favorable staking ruling, meme coin market dominance, and a 50% revenue surge for solana apps. BTCC's Ava notes, 'The combination of technical resilience and ecosystem growth—especially in DeFi and meme tokens—could fuel a rally toward $256 if key resistance breaks.' Market sentiment leans optimistic, but the $168-$178 zone remains pivotal.
Factors Influencing SOL’s Price
Solana Forms Contracting Triangle Pattern With $168 Resistance Level
Solana has rebounded from its $162 support level, now trading above $165 and the 100-hourly moving average. A contracting triangle pattern has emerged, with resistance at $168, signaling a potential breakout scenario. Technical indicators present a mixed picture: the MACD shows fading momentum, while the RSI remains above 50, suggesting cautious Optimism among traders.
The cryptocurrency's recovery follows a bounce from the $162 zone, clearing the $165 resistance and entering what analysts consider a short-term positive phase. This move pushed solana above the 50% Fibonacci retracement level of its recent decline from $172 to $162. However, bearish activity persists near the $170 zone, where the 76.4% Fibonacci retracement level continues to act as resistance.
A decisive break above $175 could propel Solana toward $182, with further upside potential reaching $192. Conversely, failure to surpass $170 may trigger another downward move, with initial support expected near $164. The 100-hourly simple moving average now serves as underlying support, while immediate resistance looms at $170, followed by the more significant $172 level.
Solana (SOL) Eyes Upside Break as Price Tests Key Resistance
Solana's SOL has initiated a fresh bullish impulse after finding firm support near $162, mirroring broader market strength seen in Bitcoin and Ethereum. The asset now consolidates above $165, with technical indicators suggesting potential for further gains if critical resistance levels are breached.
A contracting triangle pattern on the hourly chart signals impending volatility, with $168 acting as immediate resistance. Market participants are watching the $172 level closely—a decisive close above this threshold could open the path toward $175. The 100-hour moving average provides dynamic support, while Fibonacci retracement levels from the recent swing high offer key reference points for traders.
SEC Rules Liquid Staking Activities Outside Securities Regulation
The U.S. Securities and Exchange Commission has issued new guidance that could exempt certain liquid staking activities from securities regulations. This decision marks a pivotal moment for the cryptocurrency industry, particularly for protocols involving staked assets and their derivative tokens.
Industry leaders including Jito Labs, Bitwise Asset Management, and VanEck had previously petitioned the SEC to allow liquid staking tokens in proposed Solana-based exchange-traded products. The regulator's Division of Corporation Finance clarified that under specific conditions, liquid staking receipts may not constitute securities under federal law.
SEC Chairman Paul S. Atkins emphasized the agency's commitment to providing clear regulatory frameworks for emerging financial technologies. The guidance specifically addresses tokens representing staked assets and their rewards, potentially creating new opportunities for SOL and other proof-of-stake cryptocurrencies.
Pump.fun Surpasses letsBONK.fun to Reclaim Dominance in Solana Meme Coin Market
Pump.fun has overtaken letsBONK.fun as the leading meme coin launchpad on Solana, marking a significant shift in the competitive landscape. Key metrics—including 24-hour trading volume, revenue, and token launches—now favor Pump.fun for the first time since early July.
On August 6, Pump.fun recorded $144.5 million in graduation volume, dwarfing letsBONK.fun's $34.6 million. Post-graduation trading volume for Pump.fun tokens reached $525 million, compared to $305 million for letsBONK.fun. Revenue figures followed suit, with Pump.fun generating $1.38 million against letsBONK.fun's $282,342.
The resurgence underscores Pump.fun's renewed momentum, though letsBONK.fun retains a seven-day revenue lead. The rivalry highlights the volatile yet lucrative nature of meme coin ecosystems on Solana.
Solana Price Prediction: $500 Target in Sight as Key Support Level Holds
Solana's price trajectory hinges on a critical breakout at $297, with technical patterns suggesting potential upside toward $500. A 4-month ascending channel and falling wedge breakout signal renewed bullish momentum, while macroeconomic shifts favor risk assets.
The Federal Reserve's anticipated rate cuts—potentially three by 2025—could flood markets with liquidity, reigniting altcoin season. Solana stands to benefit disproportionately, with a spot SOL ETF decision looming on October 10 that may unlock traditional finance demand.
Chart analysis reveals a double bottom reversal forming NEAR $157, with resistance awaiting at $207. Market sentiment aligns with technicals: Binance data shows SOL/USDT consolidating within a defined channel since April, now primed for resolution.
Solana Apps See 50% Revenue Surge in July Amid Meme Token and Trading Activity
Solana's ecosystem accelerated sharply in July, with application revenues climbing 50% month-over-month to $164M. The network outperformed all other LAYER 1 and Layer 2 chains in fee generation for the tenth consecutive month, fueled by meme token swaps and trading tools.
Key drivers included LetsBonk.fun and increased Phantom wallet engagement, while Raydium, Pump.fun, and Jupiter Exchange emerged as the most active dApps. Jito generated $1.54M in daily fees at peak, with Jupiter DEX and Meteora occasionally exceeding $3M.
Stablecoin adoption provided additional momentum—USDC supply on Solana surpassed 12B tokens, with USDT exceeding 2B. The network continues evolving beyond meme coins, though launch platforms remain dominant revenue generators.
Solana Price Recovery Hinges on Key Market Signals
Solana's recent price action suggests a potential recovery, supported by three critical metrics. Despite a recent decline, SOL remains 10% higher over the past three months, with market signals now hinting at an upward trajectory. A rare chart formation could catalyze a short-term rally if historical patterns repeat.
Exchange selling pressure has dropped significantly, with Solana's balance on centralized platforms falling nearly 10% from 33.06 million to 30.78 million SOL between July 23 and August 5. This reduction in available supply often precedes price rebounds. Notably, SOL's price has crossed above its exchange supply trendline—a bullish crossover that previously triggered rallies of 18% in six days and 3% in three sessions.
Institutional interest remains resilient, with CME futures open interest holding steady despite price volatility. This derivatives activity suggests professional traders maintain confidence in Solana's medium-term prospects.
Solana Eyes $256 as Technicals and DeFi Momentum Fuel Bullish Sentiment
Solana (SOL) has consolidated above $165 after a sharp rally, with on-chain data revealing a Golden Cross formation—a bullish signal where the 50-day moving average crosses above the 200-day line. The $161–$166 zone now acts as critical support, with analysts targeting $189 and $206 if buyers hold this level. Mary Emerald projects a 60% surge to $256, though bearish pressure lingers as the MACD histogram remains negative.
The launch of Solana's Web3-enabled Seeker phone in 50 countries adds fundamental momentum, potentially accelerating adoption. Traders are monitoring trading volume at $189; a decisive breakout could confirm the uptrend.
Will SOL Price Hit 200?
SOL's path to $200 hinges on overcoming critical technical and psychological levels. Below is a summary of key data:
| Metric | Value |
|---|---|
| Current Price | $170.95 |
| 20-Day MA | $178.13 (resistance) |
| MACD Histogram | +9.2878 (bullish) |
| Bollinger Band Range | $154.29–$201.98 |
Ava from BTCC emphasizes, 'For SOL to reach $200, it must reclaim the 20-day MA and sustain above $185. The bullish news flow and tightening Bollinger Bands increase breakout odds, but traders should watch for volume confirmation.'
1
